Styrene Industry Capacity and Capital Expenditure (CapEx) Forecast by Region and Countries including details of All Active Plants, Planned and Announced Projects, 2022-2026
Powered by ![]()
All the vital news, analysis, and commentary curated by our industry experts.

Styrene Industry Capacity and Capital Expenditure Market Report Overview
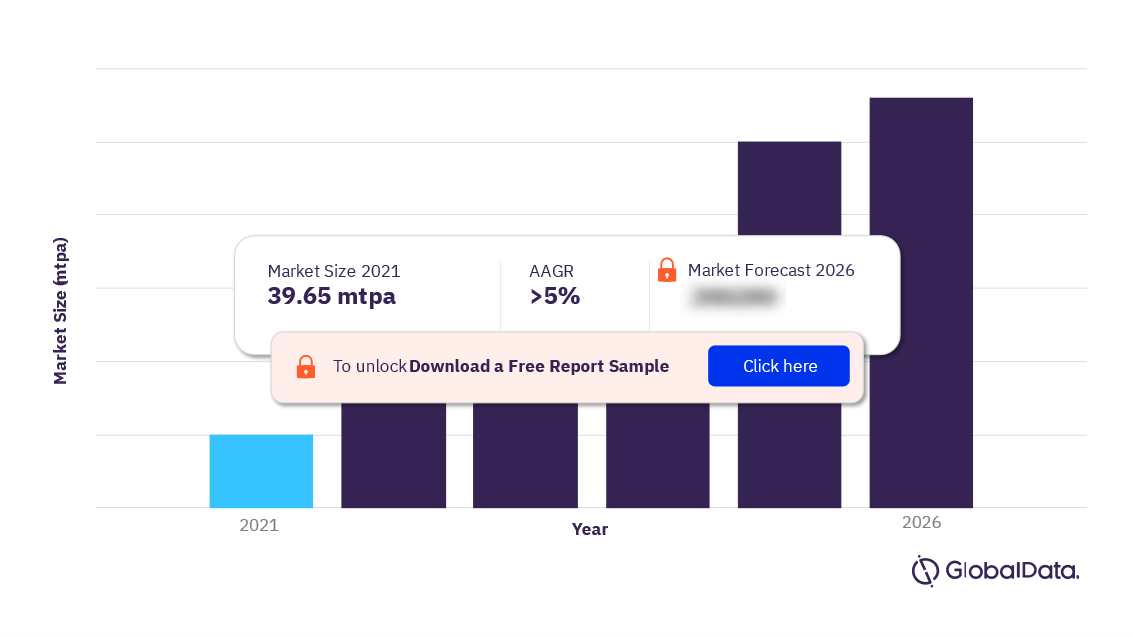
The global styrene industry capacity was 39.65 mtpa in 2021. The market is expected to achieve an AAGR of more than 5% during 2021-2026. China, the US, South Korea, the Netherlands, and Japan are the key countries in the world accounting for the dominant part of the total styrene capacity.
Styrene Industry Capacity and CapEx Outlook 2021-2026 (mtpa)
The report provides Styrene industry details such as the plant’s name, status, and plant operator name for all active, planned, announced, suspended, and decommissioned plants globally by region and country for the period 2016–2026. The report also provides global and regional capital expenditure outlook by key countries, year on year, till 2026. The report offers a comparison of key countries based on contribution to global as well as regional plant capacities. The report also provides the installed plant capacity by production process and technology for the global Styrene industry in 2021. Further, the report offers, planned and announced Styrene plants along with the development stages for the period 2022–2026.
| Market volume (2021) | 39.65 mtpa |
| AAGR (2021-2026) | >5% |
| Major Planned and Announced Projects | INEOS Styrolution La Porte Styrene Plant, Petrochina Pdvsa Guandong Petrochemical Jieyang Styrene Plant, Shandong Yulong Petrochemical Longkou Styrene Plant, Indian Oil Corporation Paradip Styrene Plant, Haldia Petrochemicals Kakinada Styrene Plant, Lianyungang Petrochemical Lianyungang Styrene Plant, Ningbo ZRCC Lyondell Chemical Ningbo Styrene Plant 2, Zhenhua Petrochemical Dongying Styrene Plant, Sinochem Quanzhou Petrochemical Quanzhou Styrene Plant, and Abel Chemical (Jiangsu) Taixing Styrene Plant 2 |
| Key Regions | Asia, Europe, the Former Soviet Union, the Middle East, North America, South America, and Africa |
| Key Companies | Shell plc, China Petrochemical Corp, Ineos Ltd, TotalEnergies SE, LyondellBasell Industries NV, Saudi Basic Industries Corp, China National Petroleum Corp, Formosa Plastics Group, and Trinseo SA |
| Key Countries | China, the US, South Korea, Netherlands, Japan, and others |
| Key Production Process | Dehydrogenation of Ethylbenzene, Oxidation of Ethylbenzene (PO/SM Process), C8 Extraction of Pyrolysis Gasoline, and Others |
| Enquire & Decide | Discover the perfect solution for your business needs. Enquire now and let us help you make an informed decision before making a purchase. |
Buy the full report for more insights on this report, download a free report sample
Major Planned and Announced Projects in the Styrene Industry
The major planned and announced projects in the styrene industry are INEOS Styrolution La Porte Styrene Plant, Petrochina Pdvsa Guandong Petrochemical Jieyang Styrene Plant, Shandong Yulong Petrochemical Longkou Styrene Plant, Indian Oil Corporation Paradip Styrene Plant, Haldia Petrochemicals Kakinada Styrene Plant, Lianyungang Petrochemical Lianyungang Styrene Plant, Ningbo ZRCC Lyondell Chemical Ningbo Styrene Plant 2, Zhenhua Petrochemical Dongying Styrene Plant, Sinochem Quanzhou Petrochemical Quanzhou Styrene Plant, and Abel Chemical (Jiangsu) Taixing Styrene Plant 2.
Styrene Industry Capacity and CapEx Segmentation by Regions
The key regions in the styrene industry are Asia, North America, Europe, the Middle East, the Former Soviet Union, South America, and Africa.
Asia: China, South Korea, Japan, Taiwan, and Singapore are the key countries in Asia accounting for the majority of the styrene capacity in the region.
North America: In 2021, the US and Canada accounted for the entire capacity growth in the region.
Europe: In 2021, the Netherlands, Germany, France, Italy, and Belgium accounted for the majority of the total styrene capacity of the region.
Middle East: In 2021, Saudi Arabia, Iran, and Kuwait were the key countries in the Middle East, accounting for the total styrene capacity of the region.
The Former Soviet Union: In 2021, Russia and Kazakhstan in FSU accounted for the total styrene capacity of the region.
South America: In 2021, Brazil and Argentina were the South American countries accounting for the entire capacity growth in the region.
Styrene Industry Capacity and CapEx Analysis by Regions, 2021 (%)

For more regional insights, buy the full report or download a free report sample
Styrene Industry Capacity and CapEx Segmentation by Production Process
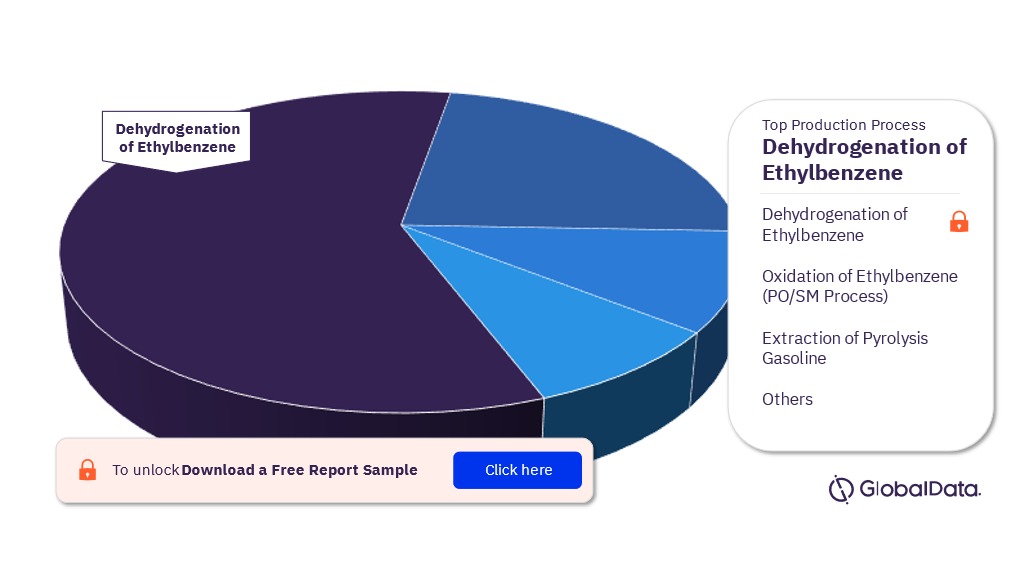
The key processes to produce styrene are Dehydrogenation of Ethylbenzene, Oxidation of Ethylbenzene (PO/SM Process), Extraction of Pyrolysis Gasoline, and others. In 2021, Dehydrogenation of Ethylbenzene emerged as the dominant process used for Styrene production.
Styrene Industry Capacity and CapEx Analysis by Production Process, 2021 (%)
Buy the full report or download a free sample report for insights on the production process in the styrene industry.
Styrene Industry – Competitive Landscape
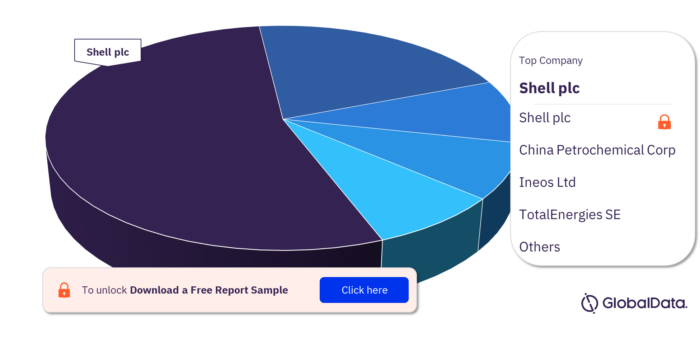
The key companies in the styrene industry are Shell plc, China Petrochemical Corp, Ineos Ltd, TotalEnergies SE, LyondellBasell Industries NV, Saudi Basic Industries Corp, China National Petroleum Corp, Formosa Plastics Group, and Trinseo SA. In 2021, Shell plc had the largest styrene capacity contribution, followed by China Petrochemical Corp and Ineos Ltd, respectively.
Styrene Industry by Companies, 2021 (%)
For more company insights buy the full report or download a free report sample
Key Segments Covered in this Report.
Styrene Industry Production Process Outlook (%, 2021)
- Dehydrogenation of Ethylbenzene
- Oxidation of Ethylbenzene (PO/SM Process)
- C8 Extraction of Pyrolysis Gasoline
- Others
Styrene Industry Regional Outlook (mtpa, 2021)
- Asia
- North America
- South America
- Africa
- Europe
- Middle East
- Former Soviet Union
Styrene Industry Country-wise Outlook (mtpa, 2021)
- China
- The US
- South Korea
- Netherlands
- Japan
- Others
Scope
This report provides:
- Global Styrene capacity outlook by region
- Global Styrene outlook by country
- Styrene planned and announced project details
- Capacity share of the major Styrene producers globally
- Global Styrene capital expenditure outlook by region
- Global Styrene capital expenditure outlook by country
Reasons to Buy
- Obtain the most up-to-date information available on all active, planned, and announced Styrene plants globally.
- Identify opportunities in the global Styrene industry with the help of upcoming projects and capital expenditure outlook.
- Facilitate decision-making on the basis of strong historical and forecast Styrene capacity data.
Table of Contents
Table
Figures
Frequently asked questions
-
What was the global styrene industry capacity in 2021?
The global styrene industry capacity was 39.65 mtpa in 2021.
-
What is the styrene industry growth rate?
The styrene industry is expected to achieve an AAGR of more than 5% during 2021-2026.
-
What are the major planned and announced projects in the styrene industry?
The major planned and announced projects in the styrene industry are INEOS Styrolution La Porte Styrene Plant, Petrochina Pdvsa Guandong Petrochemical Jieyang Styrene Plant, Shandong Yulong Petrochemical Longkou Styrene Plant, Indian Oil Corporation Paradip Styrene Plant, Haldia Petrochemicals Kakinada Styrene Plant, Lianyungang Petrochemical Lianyungang Styrene Plant, Ningbo ZRCC Lyondell Chemical Ningbo Styrene Plant 2, Zhenhua Petrochemical Dongying Styrene Plant, Sinochem Quanzhou Petrochemical Quanzhou Styrene Plant, and Abel Chemical (Jiangsu) Taixing Styrene Plant 2.
-
What are the key regions in the styrene industry?
The key regions in the styrene industry are Asia, Europe, the Former Soviet Union, the Middle East, North America, South America, and Africa.
-
Which are the key companies in the styrene industry?
The key companies in the styrene industry are Shell plc, China Petrochemical Corp, Ineos Ltd, TotalEnergies SE, LyondellBasell Industries NV, Saudi Basic Industries Corp, China National Petroleum Corp, Formosa Plastics Group, and Trinseo SA.
Get in touch to find out about multi-purchase discounts
reportstore@globaldata.com
Tel +44 20 7947 2745
Every customer’s requirement is unique. With over 220,000 construction projects tracked, we can create a tailored dataset for you based on the types of projects you are looking for. Please get in touch with your specific requirements and we can send you a quote.
Sample Report
Styrene Industry Capacity and Capital Expenditure (CapEx) Forecast by Region and Countries including details of All Active Plants, Planned and Announced Projects, 2022-2026 was curated by the best experts in the industry and we are confident about its unique quality. However, we want you to make the most beneficial decision for your business, so we offer free sample pages to help you:
- Assess the relevance of the report
- Evaluate the quality of the report
- Justify the cost
Download your copy of the sample report and make an informed decision about whether the full report will provide you with the insights and information you need.


